4 minutes time to read
This article will guide you on how to access and use the KPIs dashboard in Moralius.
To access the KPIs list screen, simply click on ‘KPIs' on the menu on the left part of the screen.
Ticket KPIs
On the upper part of the screen, you can view the ticket-related KPIs. More specifically, the following KPIs are displayed:
- Service Requests ('Open' & with 'Overdue SLA')
- Corrective Actions ('Open' & with 'Overdue SLA')
- Internal Tickets ('Open' & 'In Progress')
- Permanent Replacements ('Open' & with 'Overdue SLA')

Filters
From this part of the screen, you are able to filter the results of the KPIs that will appear below.
There are 3 available filters to use:
- Dates
You can select ‘Last Year’ to view the KPIs of the last year, ‘Current Year’ to view the KPIs of the current year, or ‘Set Filter’ to view the KPIs of your custom date selection.
- Properties
Use this filter to view the KPIs that are relevant only to the selected properties.
- Service Types
Use this filter to view the KPIs that are relevant only to the selected service types.

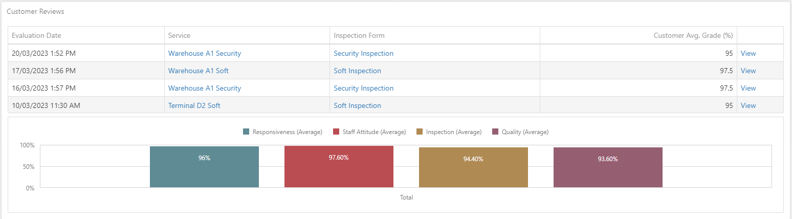
Customer Reviews
This part of the dashboard shows the inspection visit evaluations submitted by your customers. The following information is displayed:
- Evaluation Date
The date and time when the evaluation was submitted.
- Service
The service for which the inspection visit took place.
- Inspection Form
The inspection form template used at the inspection visit.
- Customer Avg. Grade (%)
The average grade provided by the customer.
Also, the graph in this section displays the average customer grades per evaluation area for all inspection visits of the selected criteria.
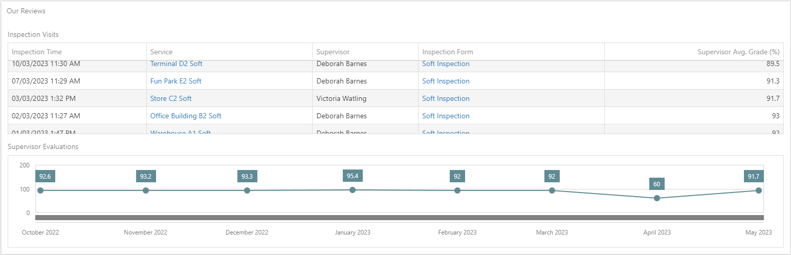
Our Reviews
This part of the dashboard shows the inspection visit evaluations submitted by your supervisors. The following information is displayed:
- Inspection Time
The date and time when the inspection visit took place.
- Service
The service for which the inspection visit took place.
- Supervisor
The supervisor that performed the inspection visit.
- Inspection Form
The inspection form template used at the inspection visit.
- Supervisor Avg. Grade (%)
The average grade provided by the supervisor.
Also, the graph in this section displays the average supervisor grades per month for all inspection visits of the selected criteria.
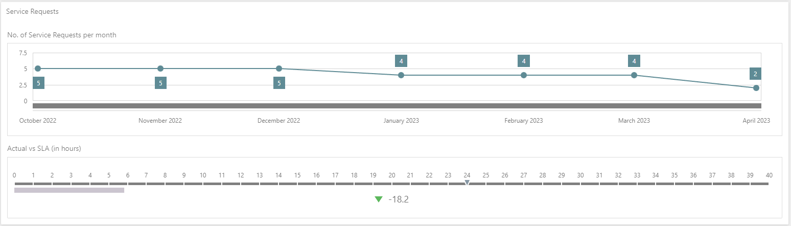
Service Requests
This part of the dashboard shows KPIs related to the service requests. More specifically, 2 graphs are displayed:
- The first graph shows the number of service requests that have been created per month.
- The second graph shows the difference between the agreed SLA with the customer and the actual resolution time of the service requests that correspond to the selected criteria.
Corrective Actions
This part of the dashboard shows KPIs related to the corrective actions. More specifically, 2 graphs are displayed:
- The first graph shows the number of corrective actions that have been created per month.
- The second graph shows the difference between the agreed SLA with the customer and the actual resolution time of the corrective actions that correspond to the selected criteria.

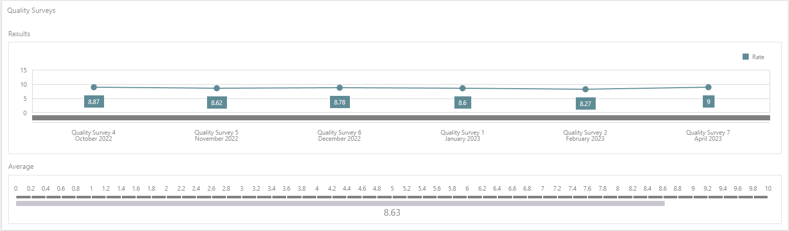
Quality Surveys
This part of the dashboard shows KPIs related to the quality surveys. More specifically, 2 graphs are displayed:
- The first graph shows the average rating of each quality questionnaire that corresponds to the selected criteria.
- The second graph shows the average rating of all quality questionnaires that correspond to the selected criteria.
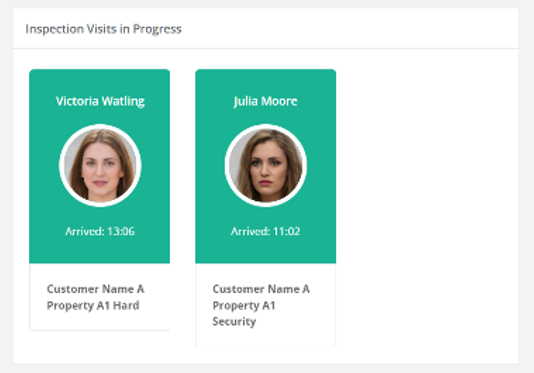
Inspection Visits in Progress
This part of the dashboard shows the inspection visits that are in progress. The following information is displayed:
- The supervisor's full name & picture.
- The arrival time of the supervisor.
- The name of the account for which the inspection visit is taking place.
- The name of the property & service for which the inspection visit is taking place.
Exporting
Note that you can export any table or graph on this page by clicking on the export icon ![]() on the top-right part of the respective table or graph. Alternatively, you can export the content of this page altogether by clicking on the export icon
on the top-right part of the respective table or graph. Alternatively, you can export the content of this page altogether by clicking on the export icon ![]() on the top-right part of the screen's filter section.
on the top-right part of the screen's filter section.