4 minutes time to read
This article will guide you on how to view or edit an existing property in Moralius.
How to view/edit a property
To view or edit a property, simply follow the steps below:
- Click on ‘Property Management’ on the menu on the left part of the screen.
- Click on ‘Properties'.
- Select the property you want to view or edit and click the pencil/eye icon (depending on your role permissions) at the right of the row.
- Change the fields that you want.
- Click on ‘Save’ if you want to save any changes.
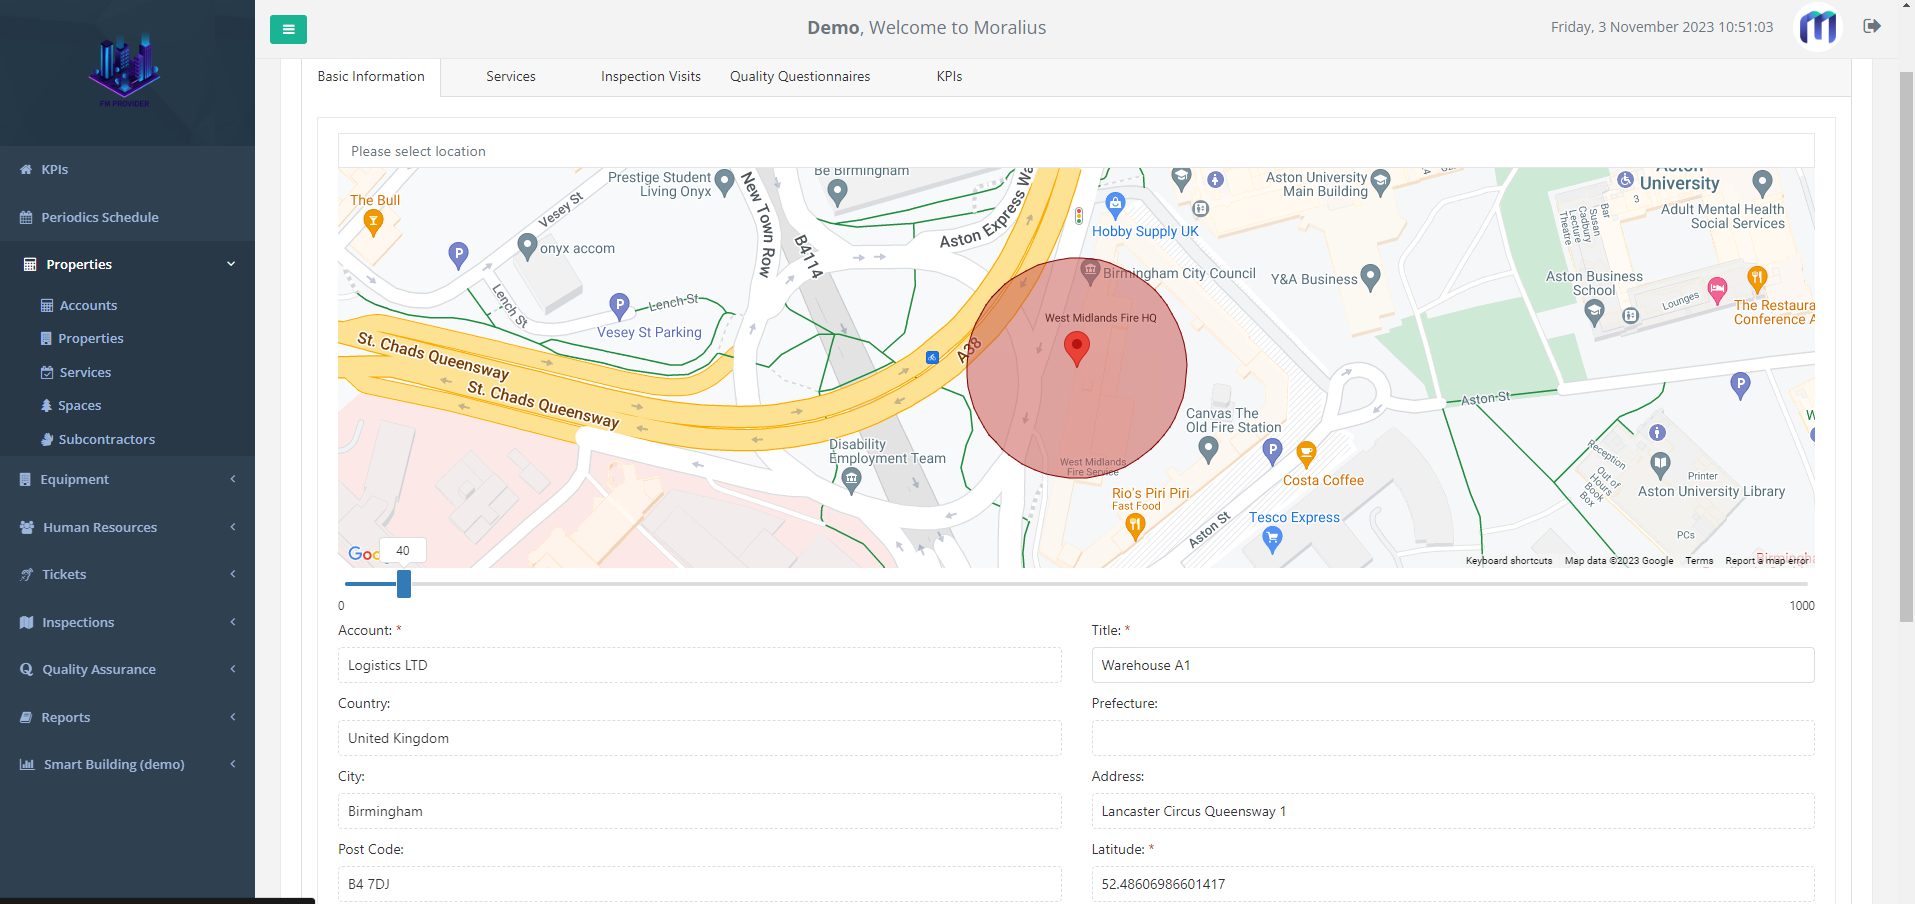
Basic information
On the ‘Basic Information’ tab you can view/edit the following fields:
- Account (non-editable)
The name of the company (account).
- Title
The title of the property.
- Address
The address of the property. To change it, type the address in the box above the map, or drag the red pin on the exact map’s location.
- Range
The range, in which a worker can check-in and out of the property. To change it, use the slide bar just below the map.
- Total Inspection Visits (non-editable)
The total number of inspection visits that have been performed on this property.
- Total Hours On Site (non-editable)
The total duration of the inspection visits that have been performed on this property.
- Avg. Grade of Customer (non-editable)
The average grade provided by the customer for this property.
- Active
Shows whether the account is active or not.
The rest of the address-related fields (City, Post Code, etc.) are automatically filled based on the selected address.
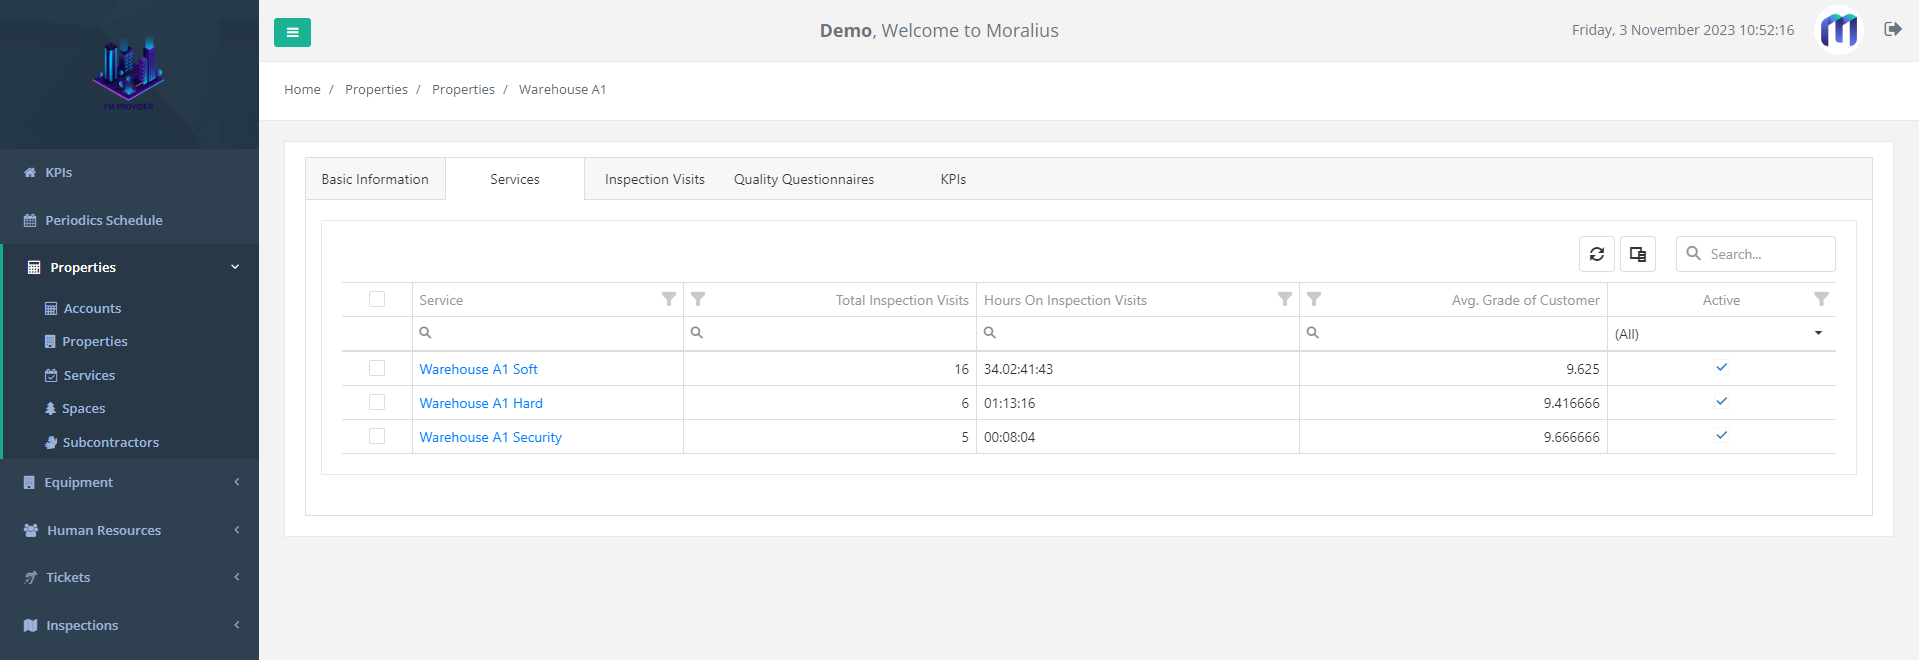
Services
On the ‘Services’ tab you can view the services linked to the property with the following fields:
- Service
The name of the service.
- Total Inspection Visits
The total number of inspection visits that have been performed for each service.
- Total Hours On Site
The total duration of the inspection visits that have been performed for each service.
- Avg. Grade of Customer
The average grade provided by the customer for each service.
- Active
Shows whether each service is active or not.
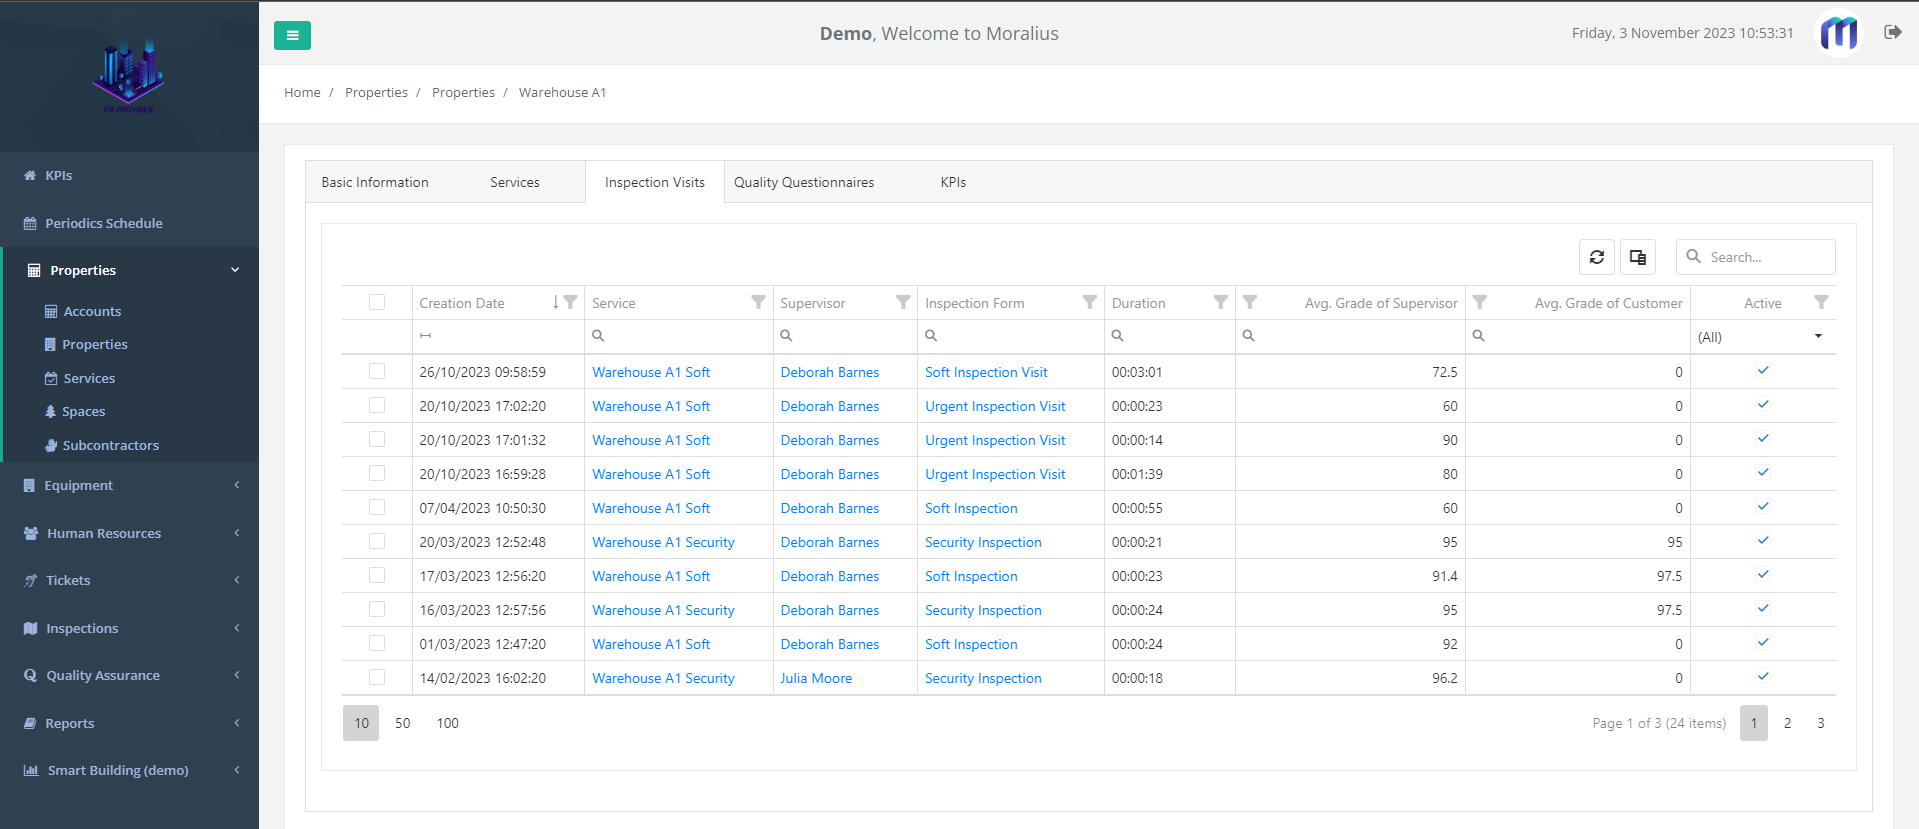
Inspection Visits
On the ‘Inspection Visits’ tab you can view the inspection visits performed at the property with the following fields:
- Creation Date
The date and time when the inspection visit was created.
- Service
The name of the service.
- Supervisor
The full name of the supervisor that is linked with the service.
- Inspection Form
The inspection template used.
- Duration
The duration of the inspection visit.
- Avg. Grade of Supervisor
The average grade provided by the supervisor.
- Avg. Grade of Customer
The average grade provided by the customer.
- Active
Shows whether the service is active or not.
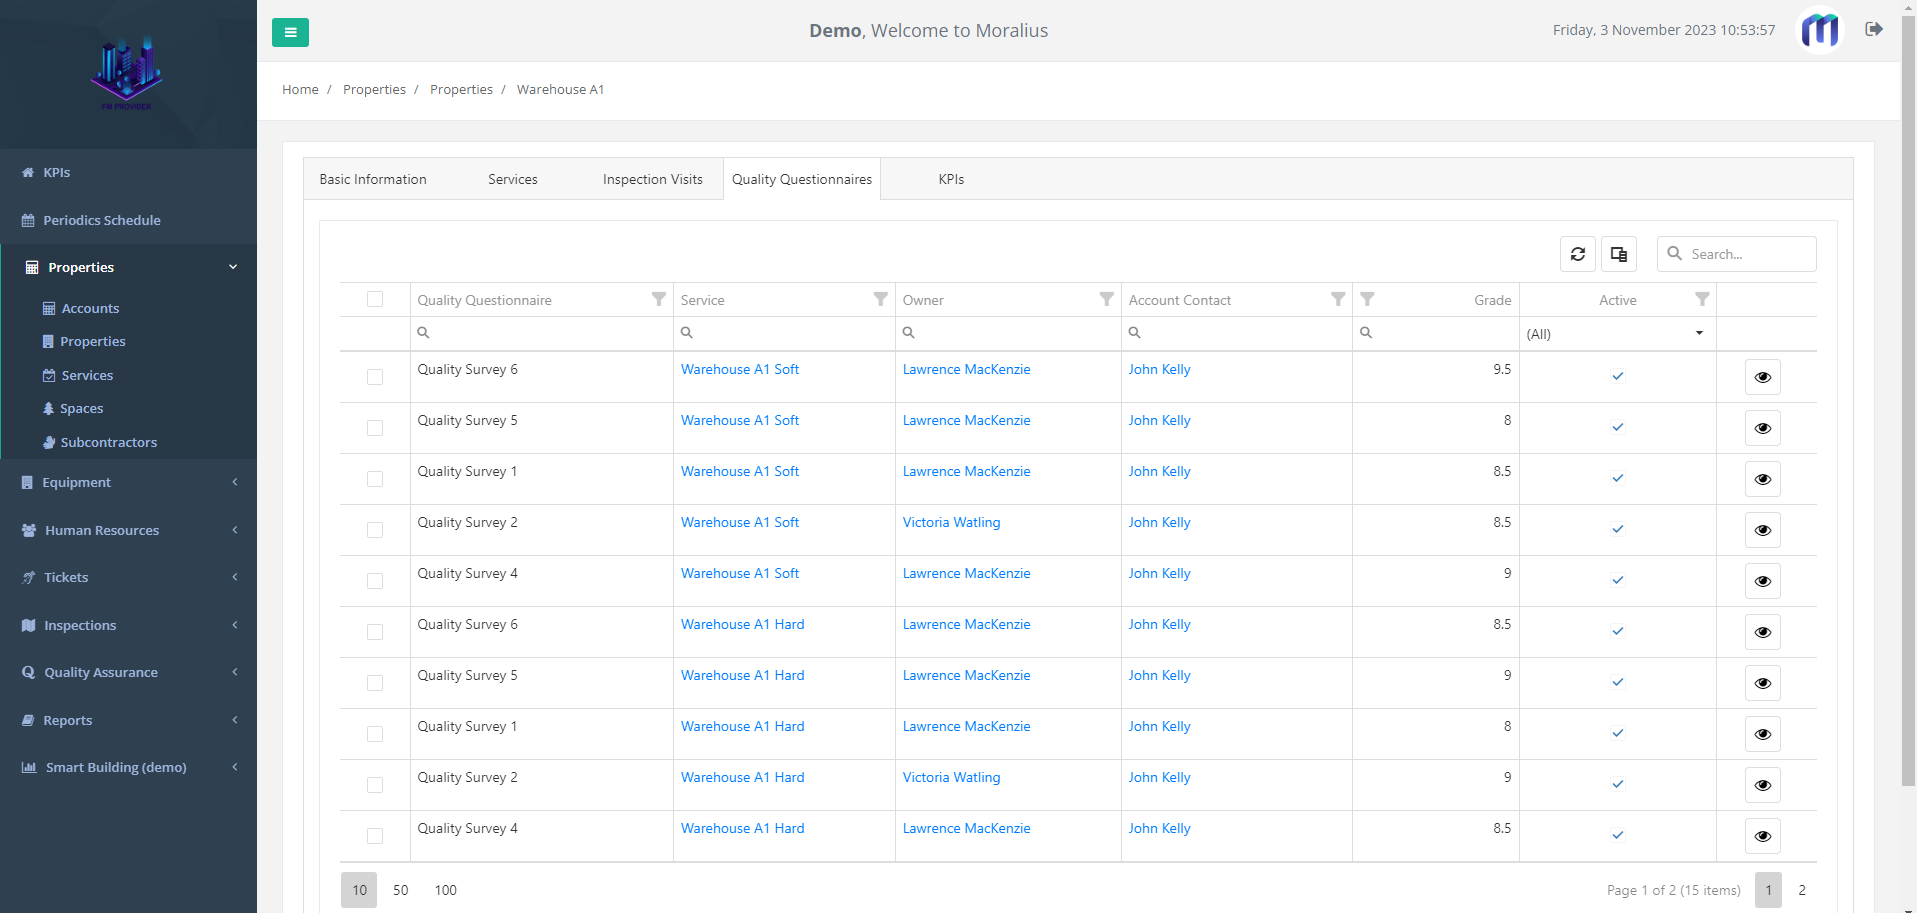
Quality Questionnaires
On the ‘Quality Questionnaires’ tab you can view the quality questionnaires linked to the property with the following fields:
- Quality Questionnaire
The name of the quality questionnaire.
- Service
The name of the service.
- Owner
The full name of the owner of the quality questionnaire.
- Account Contact
The full name of the account contact.
- Grade
The grade of the quality questionnaire.
Assets
On the ‘Assets’ tab you can view and edit the assets of the property. The available fields are the following:
- Title
The title of the asset.
- Space
The space where the asset is located in.
- Asset Category
The category of the asset.
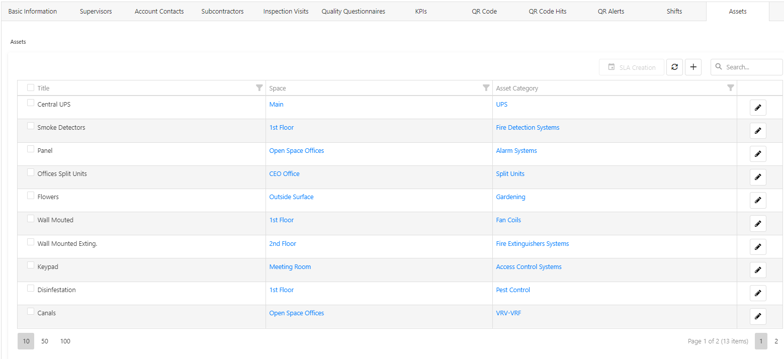
You can edit an existing asset by clicking on the pencil icon. For more information on how to edit an asset, read this article.
You can add a new asset by clicking on the + icon. For more information on how to add a new asset, read this article.
Related articles
Read this article to see how you can filter, sort and export the data of these screens, or even select which columns will appear.